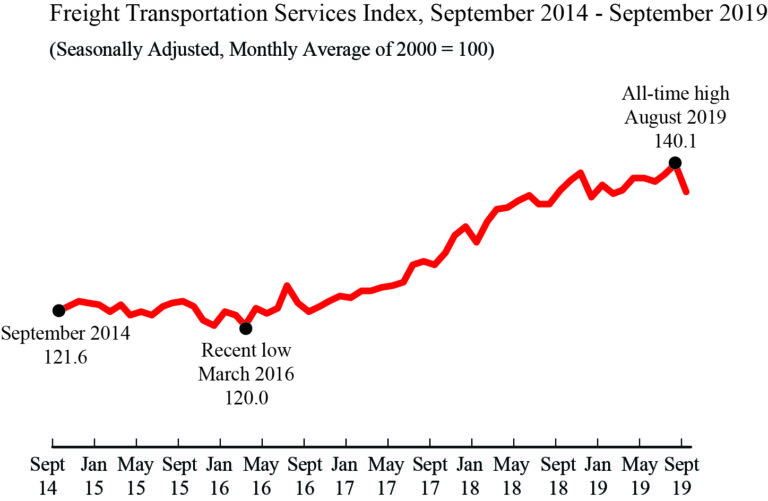
WASHINGTON — The Freight Transportation Services Index (TSI), which is based on the amount of freight carried by the for-hire transportation industry, fell 2.5% in September after reaching after reaching a new all-time high in August, according to the U.S. Department of Transportation’s Bureau of Transportation Statistics’ (BTS).
From September 2018 to September 2019, the index fell 0.1% compared to a rise of 7.2% from September 2017 to September 2018, the BTS said.
The level of for-hire freight shipments in September measured by the Freight TSI (136.6) was 2.5% below the all-time high level of 140.1 in August 2019. BTS’ TSI records begin in 2000.
The August index was revised to 140.1 from 140.6 in last month’s release, but still remains an all-time high. Monthly numbers for January through July were revised up slightly.
The Freight TSI measures the month-to-month changes in for-hire freight shipments by mode of transportation in tons and ton-miles, which are combined into one index. The index measures the output of the for-hire freight transportation industry and consists of data from for-hire trucking, rail, inland waterways, pipelines and air freight. The TSI is seasonally-adjusted to remove regular seasons from month-to-month comparisons.
The Freight TSI September decrease was broad based, driven by significant declines in water, rail carloads, trucking, pipeline and air freight, while rail intermodal increased modestly. The TSI decline took place against a background of decline in other indicators.
The Federal Reserve Board Industrial Production Index declined 0.4% in September reflecting decreases in mining and manufacturing and an increase in utilities. Housing starts, which are important to the trucking industry because trucks transport most of goods used to build homes, declined by 9.4%. The Institute for Supply Management Manufacturing index decreased 1.3 points to 47.8, indicating contraction in manufacturing
The September decline from the record high in August, was the largest one month Freight TSI decline since January 2012, and left the index at its lowest level since February 2019. However, it remained above any level it had reached before the high of September 2018 and in all but three months prior to January 2019. In effect, the Freight TSI rose 14% from 120 in March 2016 to a level of 136.8 in September 2018 but has been essentially stable (declining by 0.1 %) since then.
The 0.9% decrease in the third quarter of 2019, following two quarters of growth, and a quarter of decline in the fourth quarter of 2018. It was only the third quarterly decline since the second quarter of 2015, but it was the largest quarterly decline since the fourth quarter of 2015. The index has increased in 10 of 12 quarters since the fourth quarter of 2016. The September index was 44.1% above the April 2009 low during the most recent recession. For additional historical data, go to TSI data.
Year-to-date for-hire freight shipments measured by the index were up 0.4% in September compared to the end of 2018.
As for the long-term trend, for-hire freight shipments are up 12.3% in the five years from September 2014 and are up 37.1% in the 10 years from September 2009. 8
The Trucker News Staff produces engaging content for not only TheTrucker.com, but also The Trucker Newspaper, which has been serving the trucking industry for more than 30 years. With a focus on drivers, the Trucker News Staff aims to provide relevant, objective content pertaining to the trucking segment of the transportation industry. The Trucker News Staff is based in Little Rock, Arkansas.


